Social and podcast performance
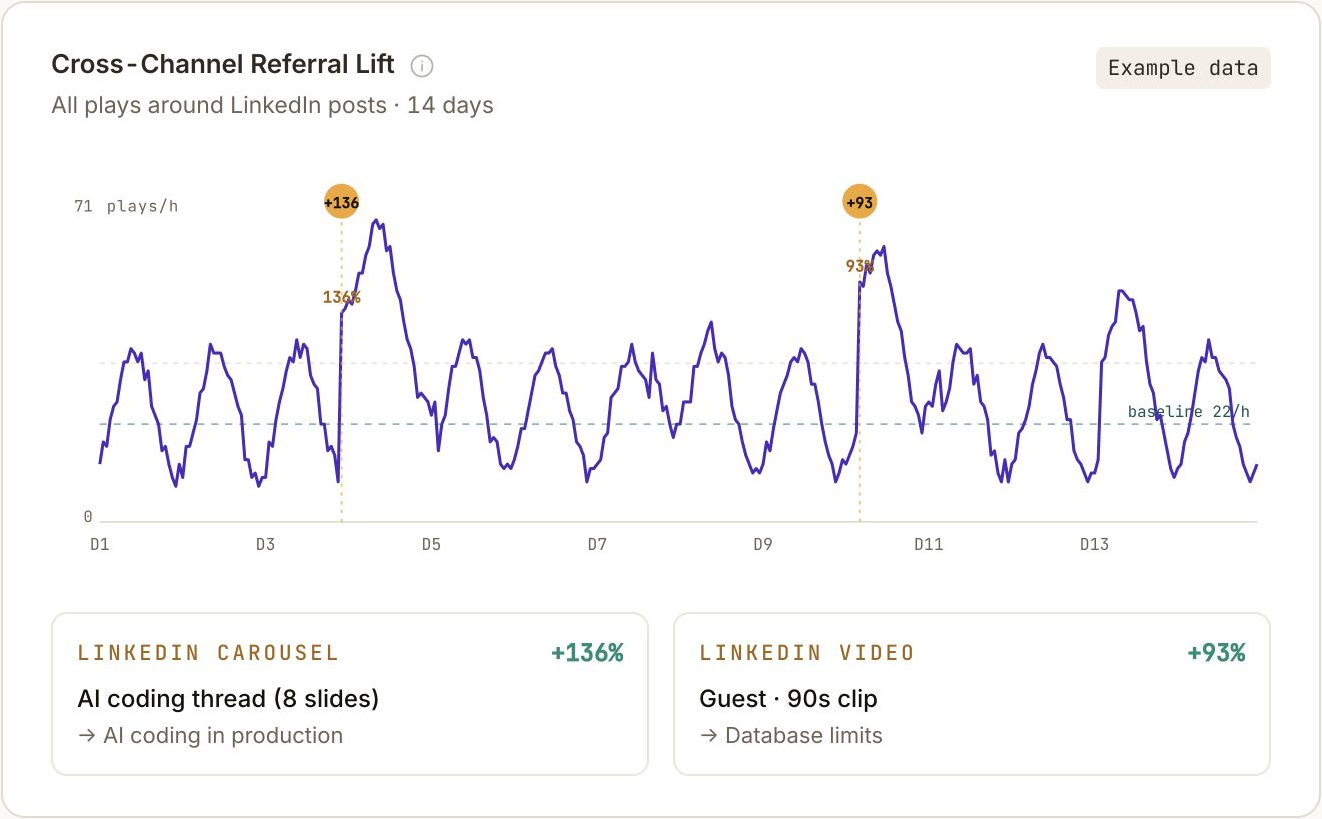
See listening patterns around your posts
Review podcast plays alongside your social post timings. Spot changes to investigate and keep that listening context in view when planning your next promotion.
The wider picture
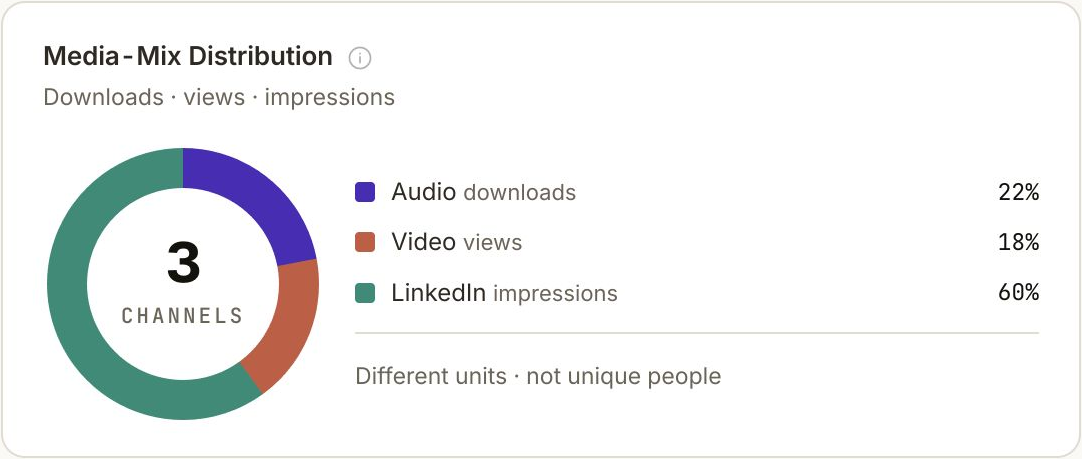
Audio, video and social
Widen the view with audio downloads, video views and social impressions. The media mix gives you an overview of activity across the content you publish.
Choosing your next test
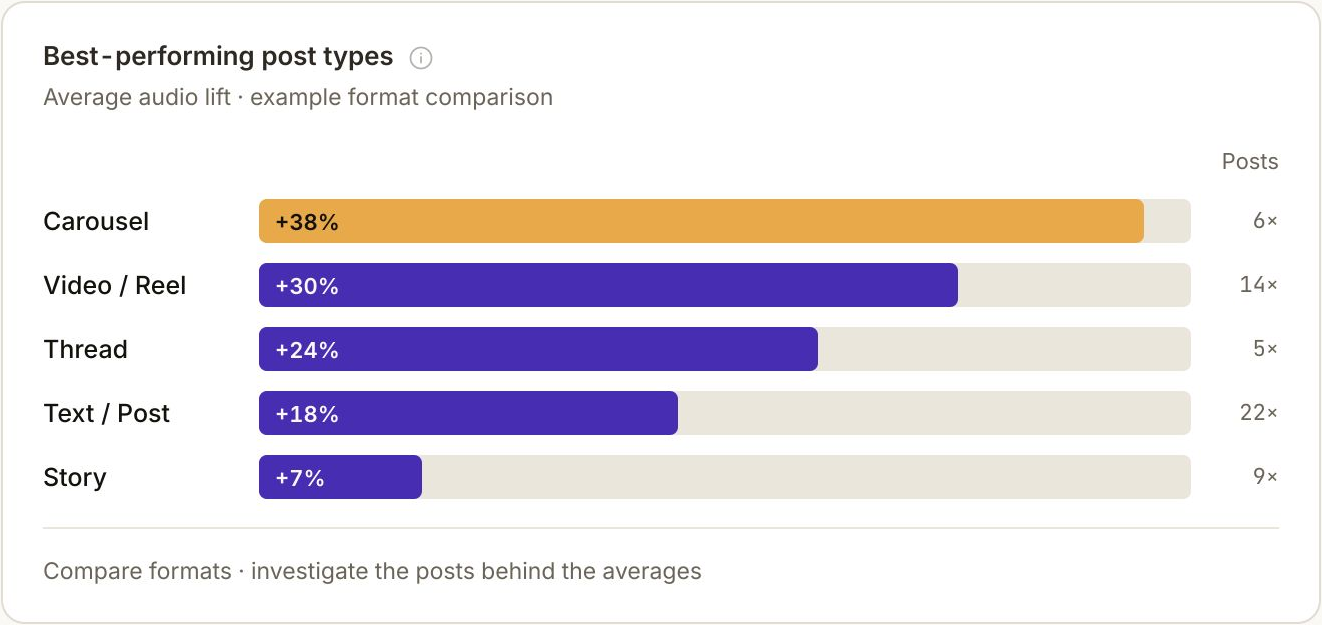
Choose a format to test with your next episode
Explore average audio lift by post type and pick a format for your next test. Follow up on the individual posts to see how they performed.
How often were the posts seen?
Impressions count how often posts were shown. Reach is reported by each platform; adding reach across posts does not give a count of unique people.
How did people respond?
Engagement rate compares reactions and comments with impressions. Reshares count where the platform supplies them, so the calculation can differ between channels.
How often did you publish?
Posting cadence shows posts per week. Read it alongside individual post results so you can see the publishing activity behind the totals.
Post details
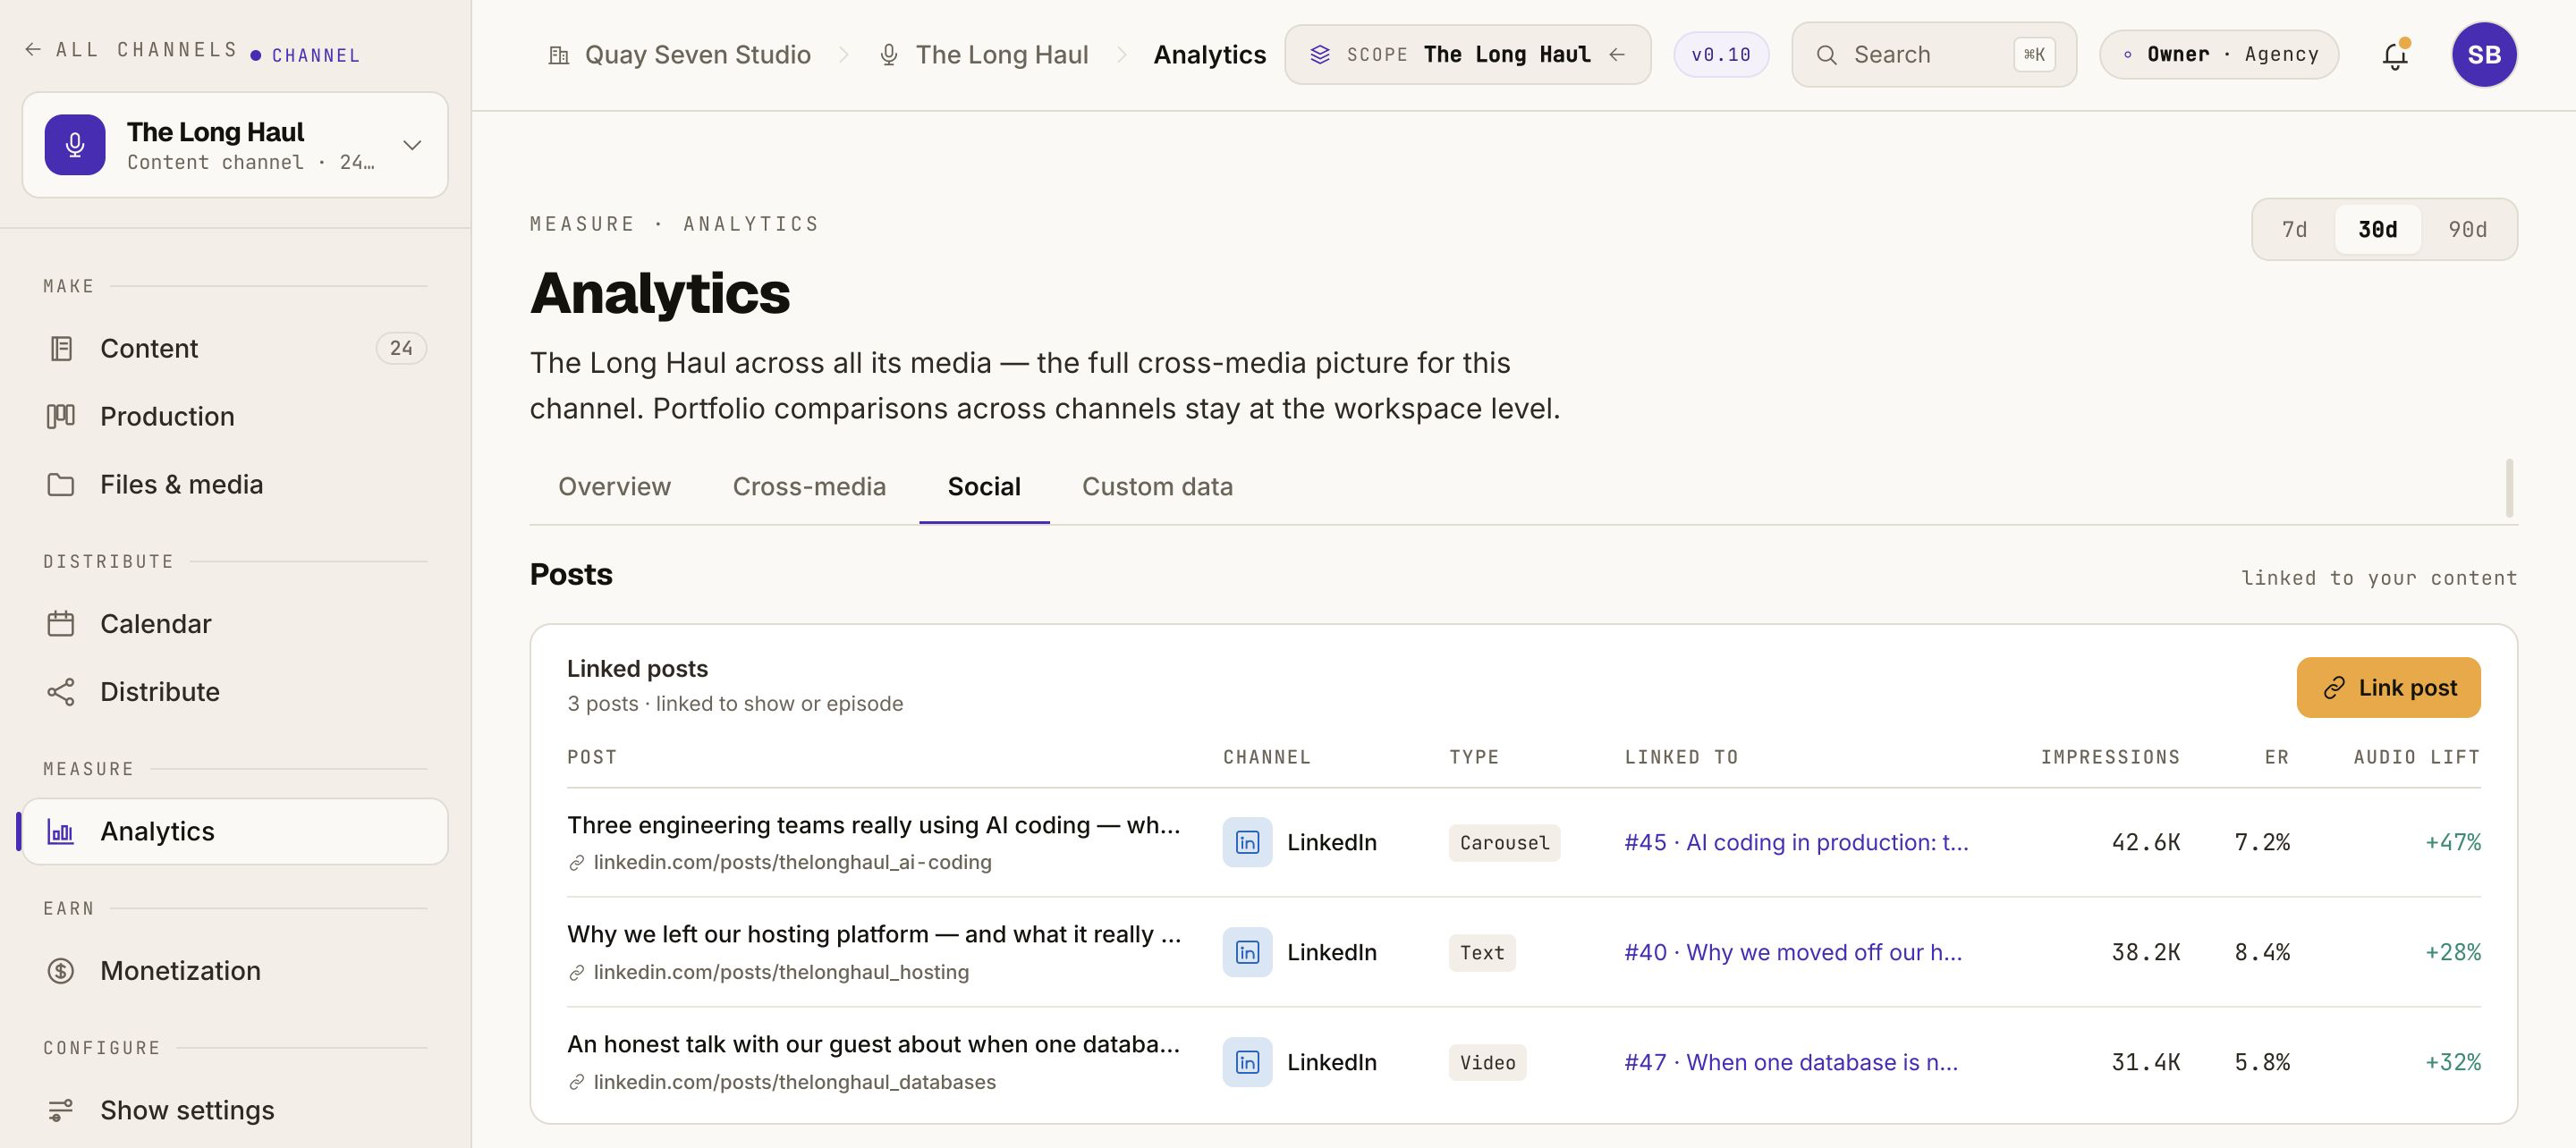
See the posts behind the totals
Review each post’s social metrics alongside its linked episode. The post table gives you the context to compare how you promoted an episode across your connected channels.
Compare individual posts when planning the promotion for your next episode. If an episode link is missing, add it manually to keep that context available.
Listening trends
Explore what happens after you post
Audio lift compares all plays in the 24 hours after a post with a baseline from the previous four weeks.
What audio lift compares
Schematic comparison windows
Use the figure as a starting point for investigating changes around a post. Other promotion and normal listening patterns can affect it. Audio lift cannot identify the post or channel behind a listen, or prove that a post caused a change.
When posts for the same episode overlap, each receives the full lift. Their figures cannot be added together as extra listeners.
Plans
Social analytics on Scale and Company
Choose the plan that fits how you manage your podcast.
Scale
Social analytics is included in Scale, alongside the features in Professional. Compare the Creator plans for the full feature list and terms.
Compare Creator plansCompany
Social analytics is also available on Company. Explore the plans and contact options for your organisation.
Explore Company plansQuestions
Questions about social analytics
Which channels and metrics are supported?
Social analytics covers LinkedIn, Instagram, Facebook and YouTube Shorts. It includes impressions, platform-reported reach, engagement and posting cadence, with details for individual posts and averages by post type. Available metrics depend on the platform; follower counts are shown where the source provides them.
Reach added across posts is not unique audience reach. Engagement rate uses reactions and comments relative to impressions, with reshares where available. A channel that is not connected offers a connection action; it is not shown as zero performance.
How often are social metrics updated?
Social metrics are updated daily. They reflect reporting from your connected platforms, which can revise their figures later. They are not a real-time view of activity.
How is audio lift calculated, and what can it tell me?
For each post, audio lift compares all plays in the following 24 hours with a baseline built from the average hourly plays in the previous four weeks. The episode’s first 48 hours after publication are excluded from that baseline. No value is shown when the baseline is below one play per 24 hours.
When posts for the same episode overlap, each receives the full lift and both count in the average. Listening activity is not split or deduplicated between posts. Earlier posts can also raise the baseline for later ones. The calculation does not adjust for the specific hour or day of the week.
Use it to explore changes around a post, with other promotion and natural listening patterns in mind. It does not attribute traffic to a post or channel, prove causation, or count extra listeners you can add together.
Which plans include social analytics?
Social analytics is available on Scale and Company. On Essential and Professional, the whole Social tab shows demo data, so you can explore the screen using example figures.
Compare Creator plans or explore Company plans to find the right fit.
Put your post results to use
Review the social performance around your episodes and choose what to test next. Find the Springcast plan that brings those insights into your podcast workflow.
Creator plans include a 14-day trial. No credit card required.
For podcast marketers
Social analytics
Put social results in the context of your podcast.
Bring LinkedIn, Instagram, Facebook and YouTube Shorts metrics alongside your podcast’s audio and video analytics. Explore listening around your posts, compare formats and decide what to try for your next episode.
Updated daily · Available on Scale and Company